Following on from my previous post looking at statistics we can pull out from the Leeds Restaurant Guide dataset, I wanted to look at how the restaurant scene has changed since we first published the guide.
Here it is:
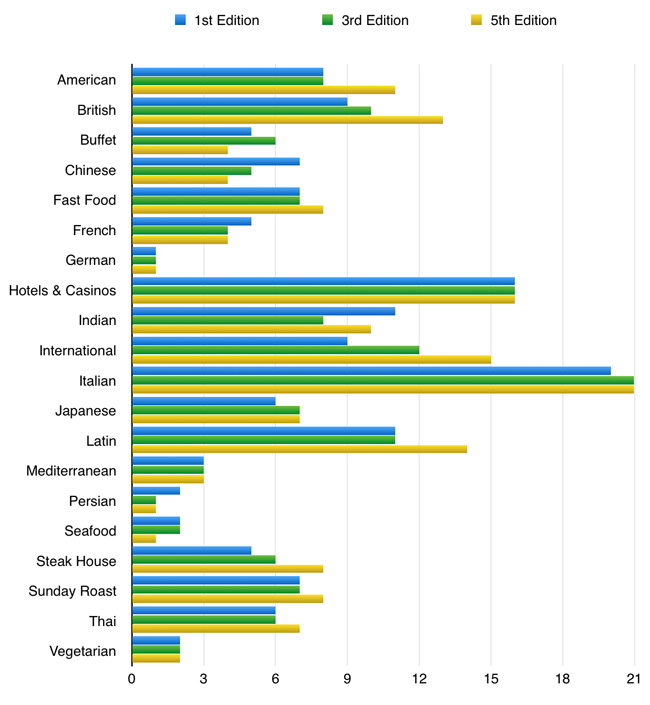
In this graph, I have plotted each cuisine type against the number of restaurants. This is shown for the 1st edition (2013), 3rd edition (2014) and 5th edition (2015). As we learned in the last post, the number of restaurants has risen, so in general, we would expect most categories to have grown between each addition. I have not included pub grub as the size of it makes the rest of the data difficult to see.
For the most part, this holds true. Some cuisines have grown faster than others though. We have seen a rise in restaurants serving American, British, International (those that serve food from all over the world with no real speciality) and steak.
In other areas we have seen a decline though. Buffet, French, Indian and seafood have all seen a decline. Persian has too, but this was always a small market. The biggest change is possibly Chinese restaurants. In the first edition we had seven Chinese restaurants, now we have only four.
In terms of the most popular cuisines, Italian remains king. When we first wrote the guide we even considered splitting Italian into two categories, one for general Italian and one for restaurants that specifically did pizza. Latin is also very popular thanks to the growth of tapas bars. It used to be equally as popular as Indian, but Indian has since fallen away.
We can draw the most popular cuisines in a table. I have omitted hotels and casinos, and international because these do not really tell us anything about people’s tastes.
| Position | 2013 | 2015 |
|---|---|---|
| 1 | Italian | Italian |
| 2 | Latin | Latin |
| 3 | Indian | British |
| 4 | British | American |
| 5 | American | Indian |
It is a pretty consistent story. The only change is that Indian has dropped off from a joint-second spot in 2013 to now being 5th, behind British and American. Much of the growth in these categories is down to meat places such as burgers and BBQ so it could be people are looking towards more meat-heavily dishes in recent years. Or it could also just be random chance. The sample size is not that big after all.


Don't have time to check my blog? Get a weekly email with all the new posts. This is my personal blog, so obviously it is 100% spam free.
Tags: cuisine, curry, data, graphs, indian, leeds, restaurants, statistics, stats
This entry was posted on Wednesday, December 23rd, 2015 at 10:58 am and is filed under Food. You can follow any responses to this entry through the RSS 2.0 feed. Both comments and pings are currently closed.