Leeds restaurants in numbers
Tuesday, December 22nd, 2015 | Food
Earlier this month I launched the 5th edition of the Leeds Restaurant Guide. Now, with five editions behind us and several years of data, I decided it would be interesting to see what we could mine from that information.
Number of restaurants
You might expect the number of restaurants in Leeds to be going up. It is, but only slightly.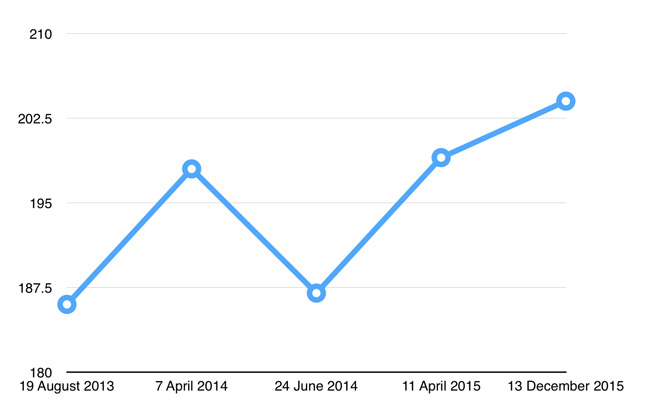
This graph shows the total number of restaurants. Over the past two and a half years the number of restaurants has increased 10%. These are not the same restaurants though. It is a case of them opening faster than they are closing.
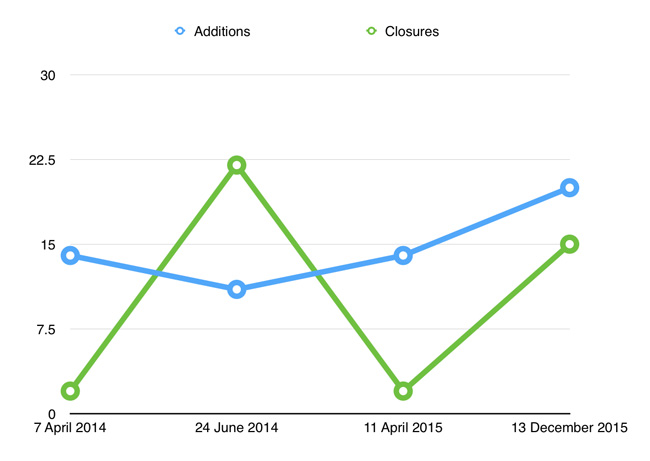
This graph shows the number of new restaurants opening and old restaurants closing between each edition. Restaurants have consistently opened while closures have been more sporadic. It is worth noting though that the release of each edition of the guide has not been equally spaced, even though it is shown this way on the graph, so that distorts the picture somewhat.
How we rate
Most restaurants are likely to be middle-of-the-road, with some not so good restaurants, some very good restaurants, and a few poor and excellent restaurants at either ends. So what happens when you plot frequency against rating?
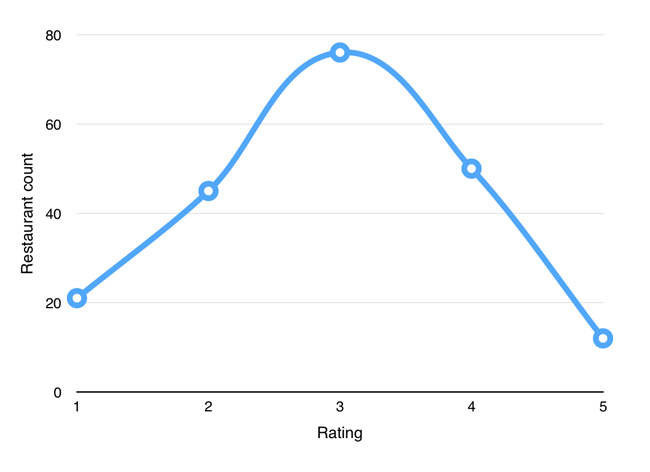
Ah, just what we wanted: a beautiful bell curve! Two is a little low for a perfect curve, but normal distributions are often imperfect in the real world. This suggests to me that our ratings are consistent with what you would expect from restaurants running in the free market.
That only shows data from restaurants that are still open. What about restaurants that have closed?
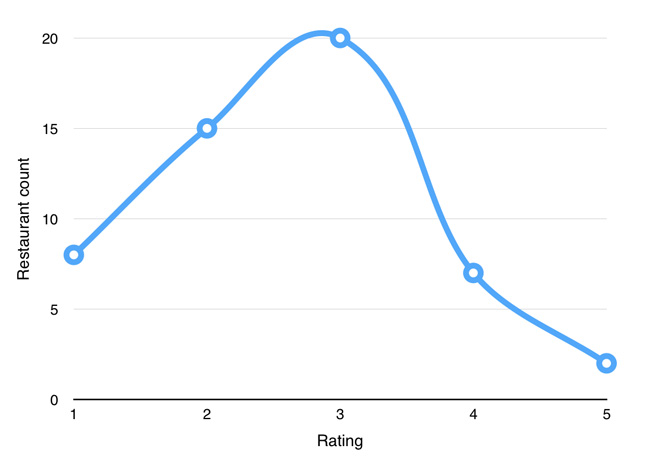
What we would expect to see here is a little less clear. Perhaps that 1-rating is the highest as poor restaurants should close the most. But given there are some many 3-rating restaurants, this might not be the case, and you may have to adjust it for frequency to see such a result. As it is we have another bell curve.
There is a clear asymmetry in the graph though. Far more 1-rating restaurants close than 5-rating restaurants, and far more 2-rating restaurants close than 4-rating restaurants, indicating that our ratings are broadly consistent with where the market chooses to spend, or not spend, it’s money.
What type of food is the best?
What cuisine produces the highest standards? Can you provide any correlation between the type of food and how good a restaurant is?
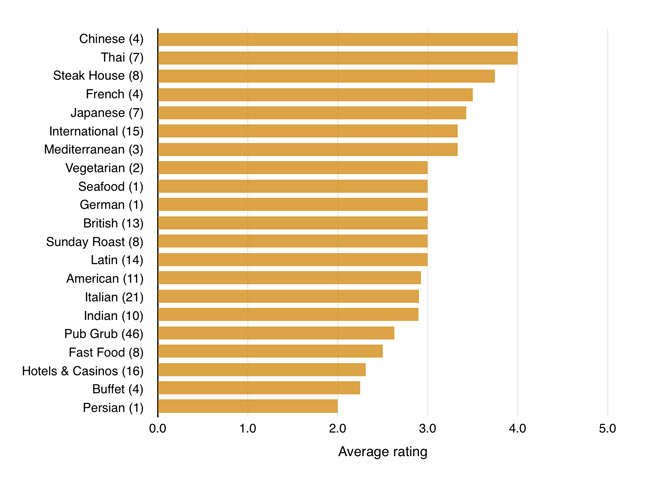
This graph shows each cuisine type and the average rating it receives. No category can maintain an average rating lower than 2 or higher than 4 because no range of restaurants can be that consistent.
I was not surprised to see Thai so high up. Steakhouses are also typically on the higher price range, so score well (though we do factor in price to an extent when awarding ratings). Chinese scoring to high is mostly a result of the less nice Chinese restaurants closing down.
The number in brackets after each cuisine indicates the number of restaurants in that category. So the ratings for Persian, German and seafood are pretty meaningless because it is based on a single restaurant.
What useful information we can draw from this is less clear. Just because the average restaurant scores well or poorly does not mean that all restaurants will. There are bad Thai restaurants for example (actually, there aren’t, but there used to be one) and good Indians (lots of them!). However, if you were to avoid eating at new hotels, casinos, fast food and pubs based on it being unlikely to be a good meal, few people would fault you for that.
Earlier this month I launched the 5th edition of the Leeds Restaurant Guide. Now, with five editions behind us and several years of data, I decided it would be interesting to see what we could mine from that information.
Number of restaurants
You might expect the number of restaurants in Leeds to be going up. It is, but only slightly.
This graph shows the total number of restaurants. Over the past two and a half years the number of restaurants has increased 10%. These are not the same restaurants though. It is a case of them opening faster than they are closing.
This graph shows the number of new restaurants opening and old restaurants closing between each edition. Restaurants have consistently opened while closures have been more sporadic. It is worth noting though that the release of each edition of the guide has not been equally spaced, even though it is shown this way on the graph, so that distorts the picture somewhat.
How we rate
Most restaurants are likely to be middle-of-the-road, with some not so good restaurants, some very good restaurants, and a few poor and excellent restaurants at either ends. So what happens when you plot frequency against rating?
Ah, just what we wanted: a beautiful bell curve! Two is a little low for a perfect curve, but normal distributions are often imperfect in the real world. This suggests to me that our ratings are consistent with what you would expect from restaurants running in the free market.
That only shows data from restaurants that are still open. What about restaurants that have closed?
What we would expect to see here is a little less clear. Perhaps that 1-rating is the highest as poor restaurants should close the most. But given there are some many 3-rating restaurants, this might not be the case, and you may have to adjust it for frequency to see such a result. As it is we have another bell curve.
There is a clear asymmetry in the graph though. Far more 1-rating restaurants close than 5-rating restaurants, and far more 2-rating restaurants close than 4-rating restaurants, indicating that our ratings are broadly consistent with where the market chooses to spend, or not spend, it’s money.
What type of food is the best?
What cuisine produces the highest standards? Can you provide any correlation between the type of food and how good a restaurant is?
This graph shows each cuisine type and the average rating it receives. No category can maintain an average rating lower than 2 or higher than 4 because no range of restaurants can be that consistent.
I was not surprised to see Thai so high up. Steakhouses are also typically on the higher price range, so score well (though we do factor in price to an extent when awarding ratings). Chinese scoring to high is mostly a result of the less nice Chinese restaurants closing down.
The number in brackets after each cuisine indicates the number of restaurants in that category. So the ratings for Persian, German and seafood are pretty meaningless because it is based on a single restaurant.
What useful information we can draw from this is less clear. Just because the average restaurant scores well or poorly does not mean that all restaurants will. There are bad Thai restaurants for example (actually, there aren’t, but there used to be one) and good Indians (lots of them!). However, if you were to avoid eating at new hotels, casinos, fast food and pubs based on it being unlikely to be a good meal, few people would fault you for that.