Back in March, I announced Covidman self-supported triathlon to train for while everything else was cancelled. It took a back seat during GVRAT and would have been replaced by Dalesman if it had not been cancelled two weeks after being announced. But now it’s back on.
With one tweak, however. I’m changing the name. Covidman made sense back in March as a symbol that through all of the changes we had to make to keep people safe, we were still going to enjoy life and do what we love.
But the British government hasn’t kept people safe. Excess deaths have now reached over 60,000. It is one of the worst death rates in the world. And, in that light, the name Covidman seems too lighthearted for such a tragic situation. So, I’m renaming it Woolenman in honour of Leeds’s history.
I hsven’t been doing any fast running recently. The endless base miles for GVRAT have been slow plods and Ironman VR14 was an easy run, too.
However, I decided to do VR15 as a brick. Not the full 40 km bike and 13 km run, as I had already done 100 km on the bike the day before. But, as a warm-up, I did a 20 km blast up to Horsforth and back on the bike before setting off on the run.
The first two kilometres were a little sluggish but the rest were down around 4:40 per kilometre, finishing on a 4:05. Total time for the 10km was 47:12, which is one of the fastest 10ks I have ever run. So, pretty pleased with that. Although, there is an important caveat that I took a break at the turnaround point, so it’s technically a Ross Barkley time.
I was originally planning to do the 13 km as one fast block, but after stopping my watch and restarting it for the 3km, I realised I burnt my legs trying to get a good 10k time. So, I finished off the final 3km in a still-not-shabby 5:00 per kilometre.
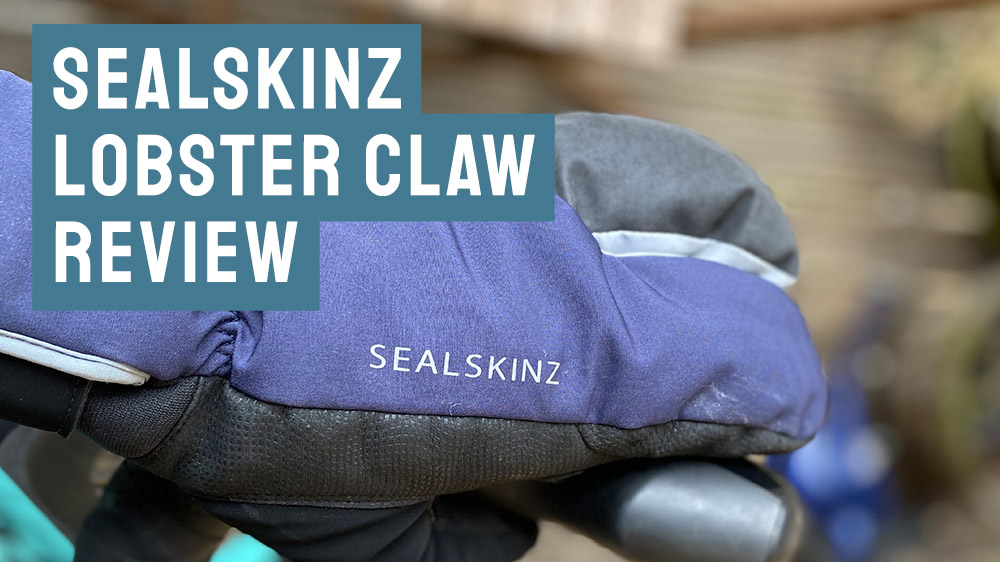
It’s not quite a glove and it’s not quite a mitten: the Sealskinz split finger glove, also known as the lobster claw, is my go-to glove when the weather gets really cold. But it also broke really easily. Here is the video review:
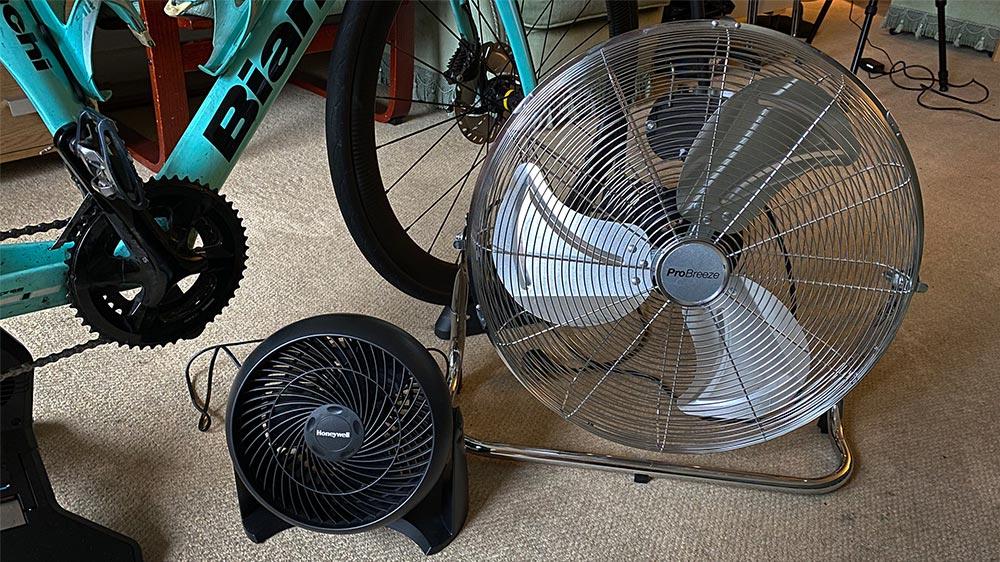
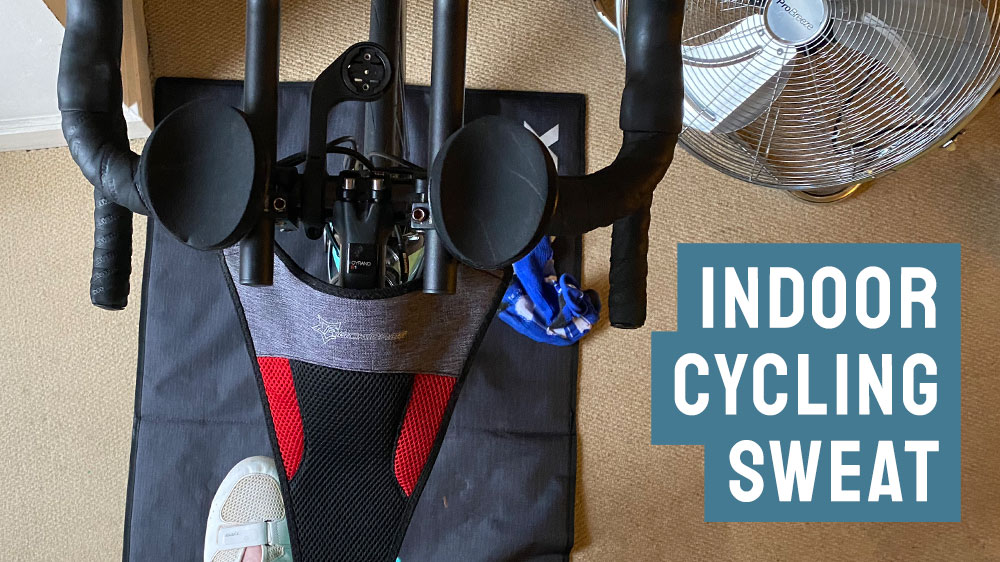
How do we avoid drowning in our own sweat when indoor cycling? If you use a turbo trainer, you will probably be familiar with it being one of the sweatiest things you can do. In this video, I’ll give you five ideas for making it manageable.
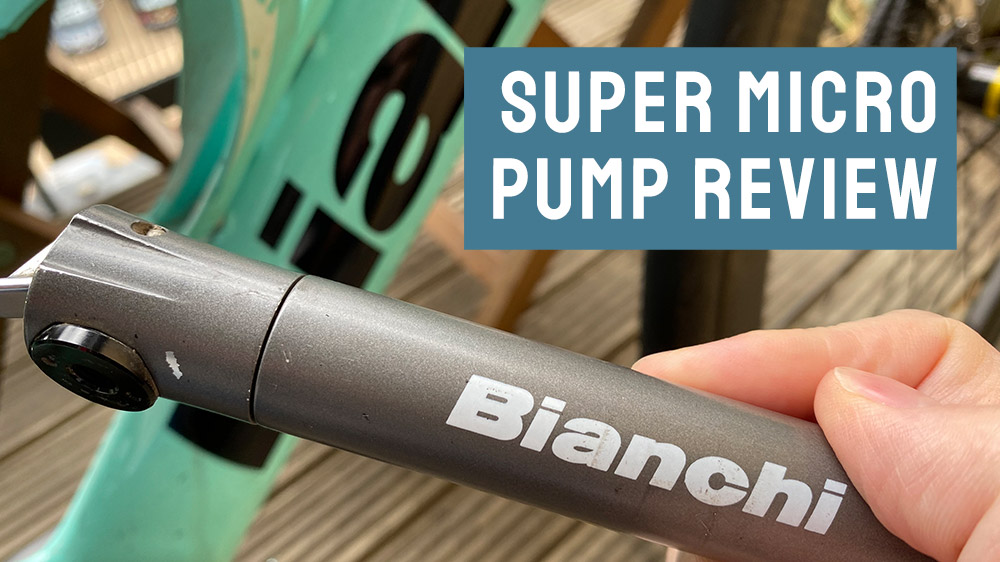
There are mini pumps, then there is the Bianchi super micro. It’s really, really small for a bike pump.
I took me a while to get hold of because I wanted someone to recommend it but all of the shops said it was too small. Finally, an officially licenced Bianchi retailer said it was great (surprisingly), so I bought it from them. If there was any justice, at this point, it would turn out to be crap. But they were actually telling the truth and it’s a really good pump.
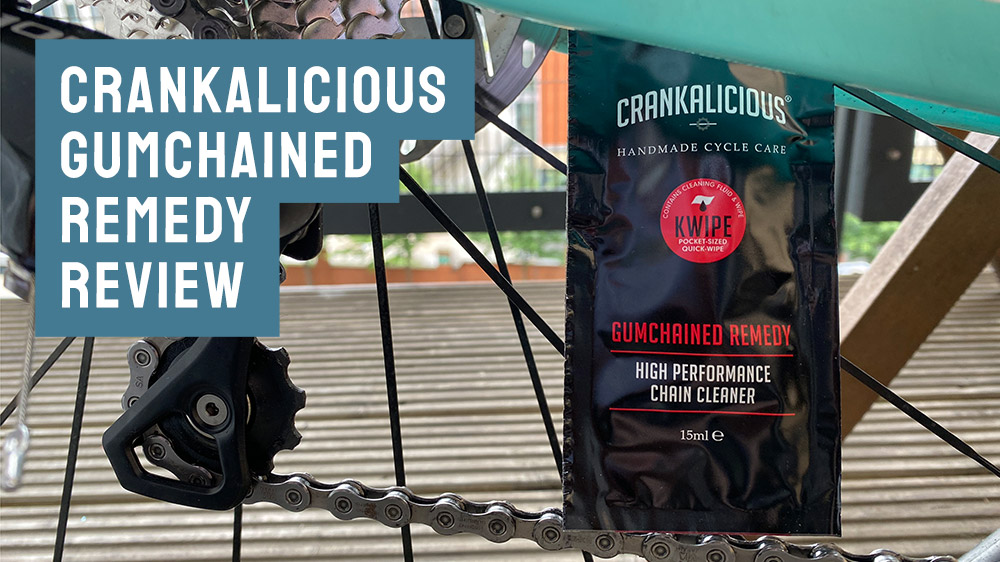
Crankalicious is a British-based bike cleaning product brand and their Gumchained Remedy chain cleaning wipes are amazing. Mostly because they make it easy enough for me to actually bother cleaning my chain. Check it out:
Now that I have my bike back, and have prep for Dalesman to do, I am back on the Ironman VR events. I did not feel much like running after GVRAT but luckily it was only a sprint distance, so a 6.5 km run combined with my existing bike rides did nicely.